Debugging Business Rules
So far in this module, debugging has primarily been:
The strategies used so far are useful but are inadequate for fully debugging. Additional debugging strategies are:
System Logs
The scoped GlideSystem API has logging methods:
All of the logging methods write to the System
Log. Pass strings, variables that resolve to strings, or methods that
resolve to strings into the logging methods.
gs.error("The value of the Short description field is " + short_description);
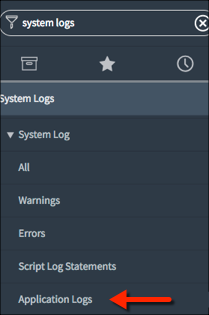
To view the log messages, open System Logs > System Log > Application Logs from the Application Navigator in the main ServiceNow browser window (not Studio).

This script uses the info(), warn(), and error() methods.

The log messages display the time created, verbosity level, message, scope, and script name.

The scoped GlideSystem API also has a
gs.debug() method. By default, debug information is not logged even if
the gs.debug() method is used in a script. To enable the gs.debug()
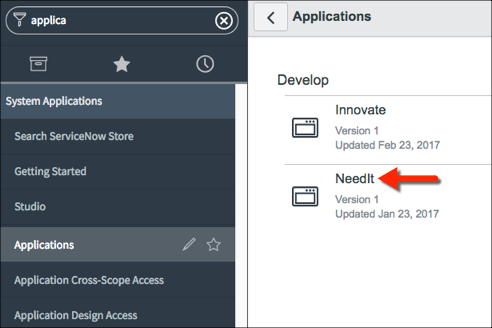
method, use the Application Navigator to open System Applications > Applications.
Click on the application name to open the application record (Don’t
click the Edit button for the application as that opens the application
for editing in Studio.) In the Related Links section, click the Enable
Session Debug link. This option writes debug information to the bottom
of forms and not to the system log.

Debug Business Rules (Details)
To debug the Condition field script, enable detailed Business Rule Debugging. Use the Application Navigator to open System Diagnostics >Session Debug > Debug Business Rules (Details).
This module turns on logging of debug information to forms and lists.
Open the form for a record of interest and force the Business Rule you
are debugging to execute by doing whatever is necessary to trigger the
Business Rule.

To turn off detailed Business Rule debugging, navigate to System Diagnostics > Session Debug > Disable All.