JavaScript Debugger
The JavaScript Debugger is the primary strategy for debugging Business Rules and other synchronous server-side scripts.
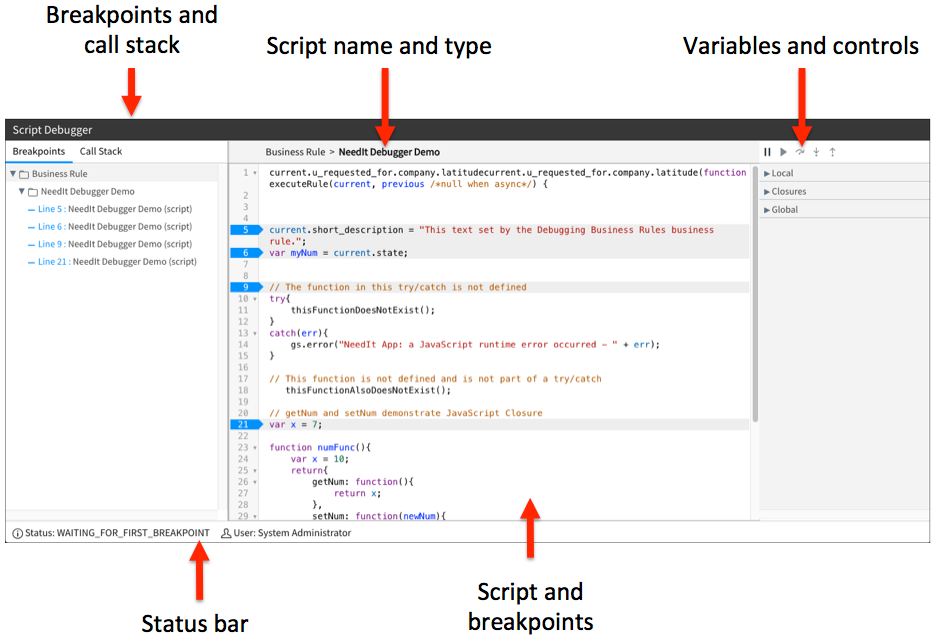
The JavaScript debugger components are:
Launching the JavaScript Debugger
Only users with the admin or script_debugger roles can use the JavaScript Debugger.
There are multiple ways to launch the JavaScript Debugger:
- Select the JavaScript Debugger button (
 ) in the Script editor toolbar.